
Solutions
The implemented solutions track and display the location, volume, type, and status of all development activities in the City of Toronto spatially and temporally. The goal is to considerably reduce the difficulties faced when searching for settlement sites in the area. The solutions implemented are outlined below.
ArcGIS Web Map
https://fleming.maps.arcgis.com/apps/mapviewer/index.html?webmap=fe7a0d9a6afc45cbbeb8f1ae499286a0
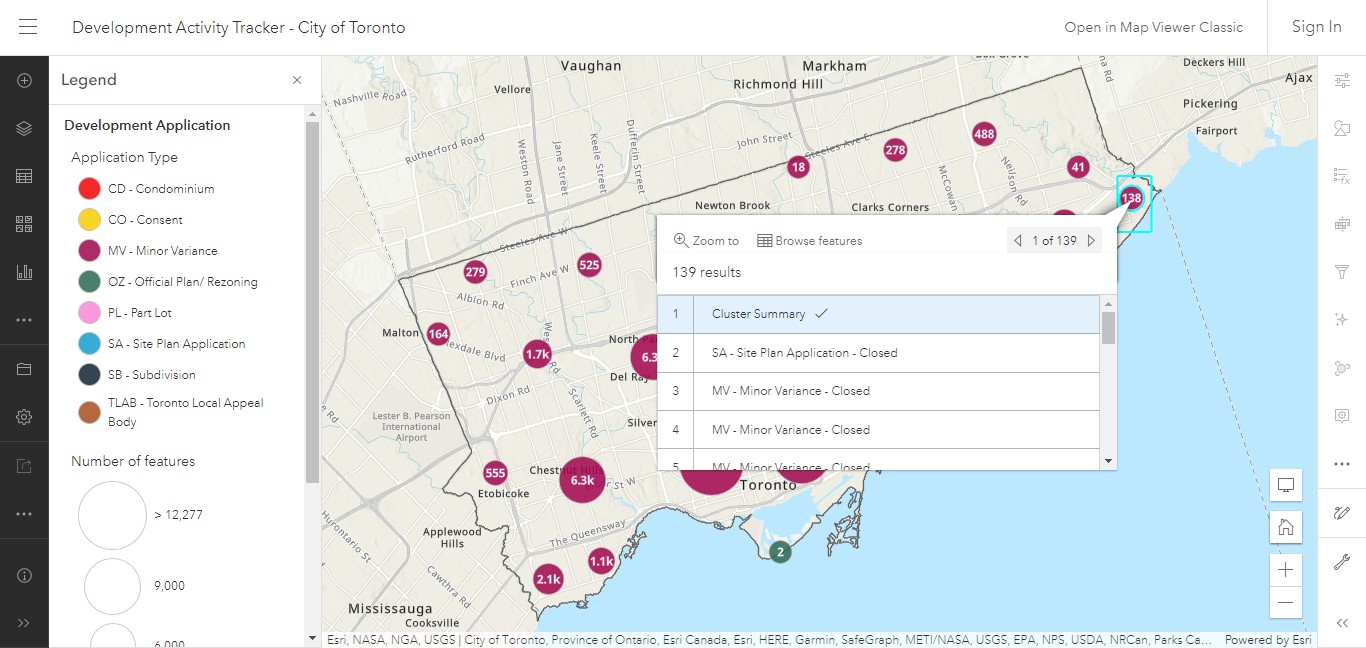
The web map is the base on which all the other applications were based and forms the core of the project. The development activities are categorized into application types, active and closed, and sorted by date. It gives the user the ability to view all the development activities in the city of Toronto from 2008 to present, all in one place. It allows the user to view the location, type, status, and date of the application by clicking on any one and viewing the details in the pop-up window. The volume of these activities in a given radius is also displayed by grouping them into clusters on zoom. The Dashboard and Experience Builder were used to enhance the user experience to make the web map more interactive.
ArcGIS Dashboards
https://fleming.maps.arcgis.com/apps/dashboards/91e38f76024d4dea902137ae41fc2195
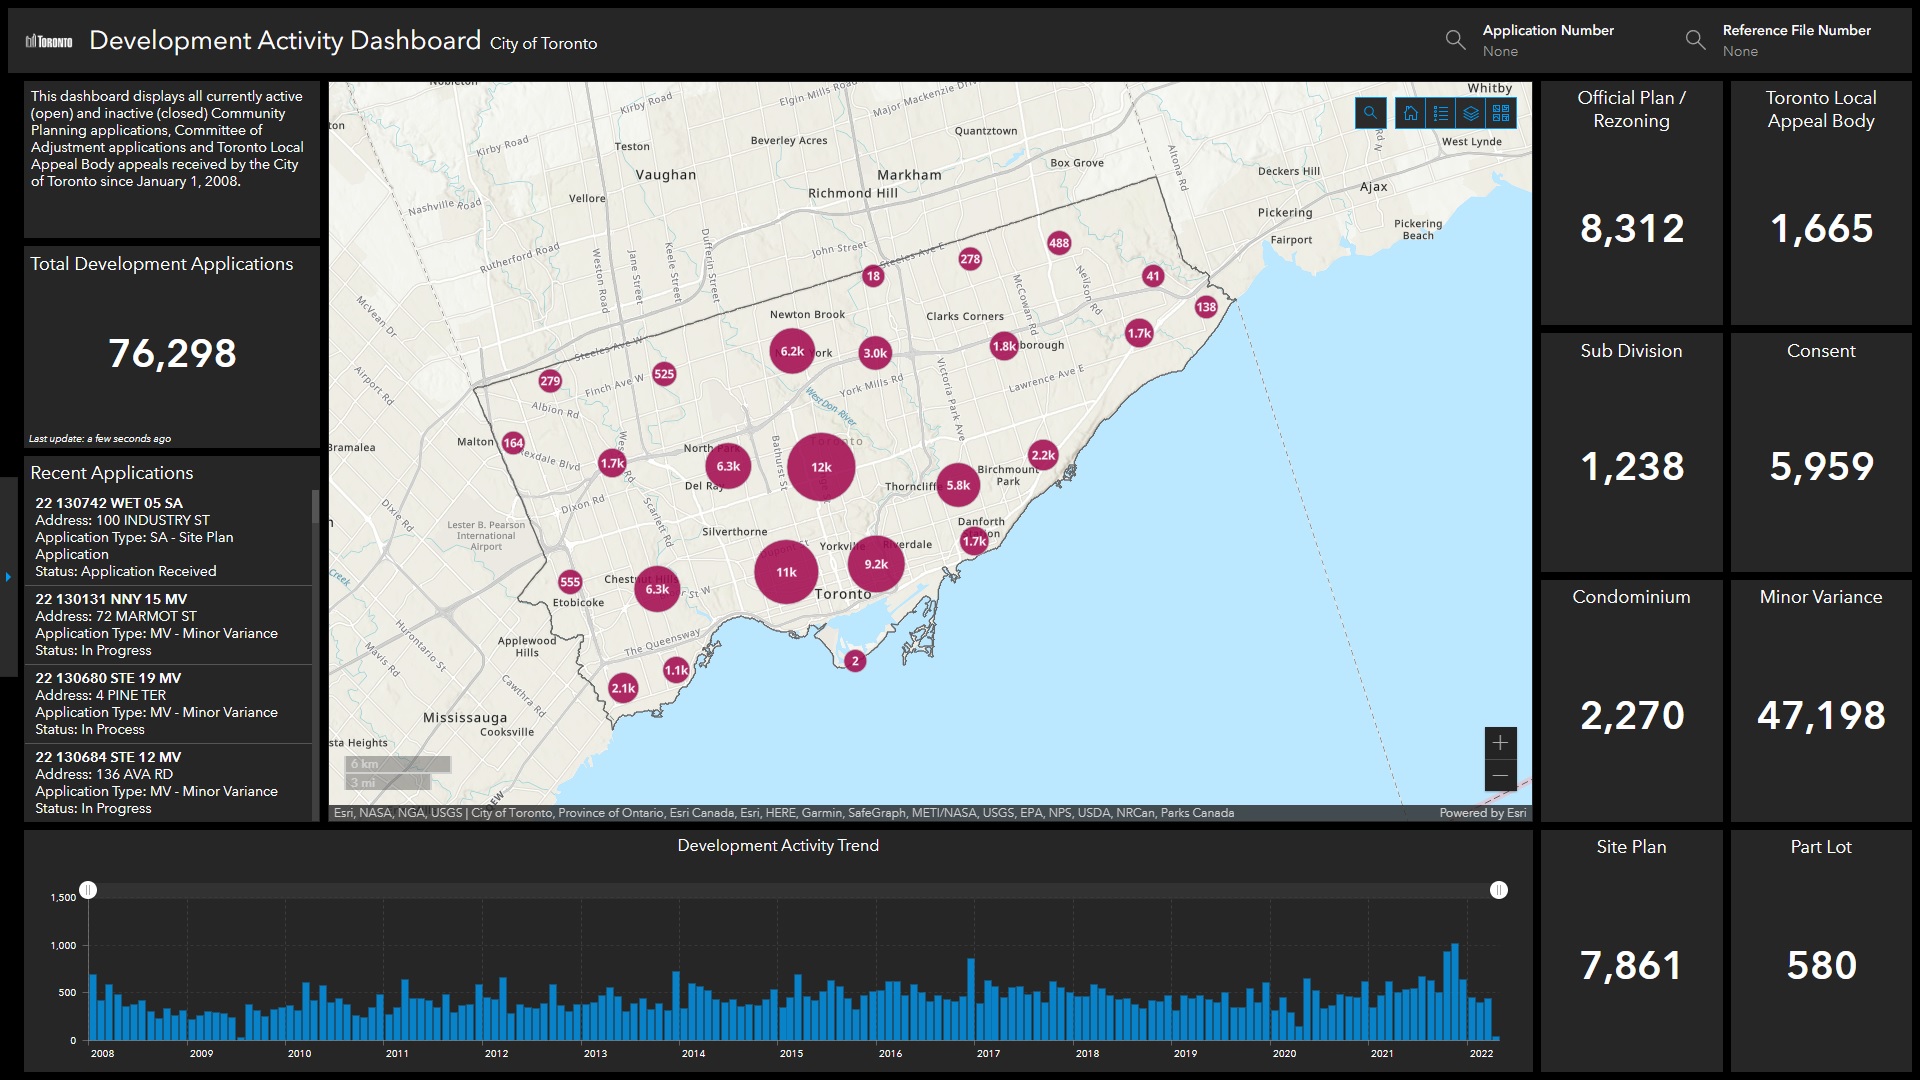
The dashboard allows the users to monitor various development activities in Toronto on a single screen. The web map is embedded which allows the users to explore the development activities interactively. A graph illustrating the development application counts in the previous years is displayed at the bottom of the dashboard, showing the development trends in Toronto. The scrollbar in the graph allows the users to explore the development pattern in a specifc date range. A list of recent applications and the total count for various development application types is updated based on the current map extent. By clicking on the recent application in the list, the map zooms in to the corresponding location, and a pop-up is displayed automatically.
ArcGIS Experience Builder
https://experience.arcgis.com/experience/499362549fde45edb0f3b958060ac1c6
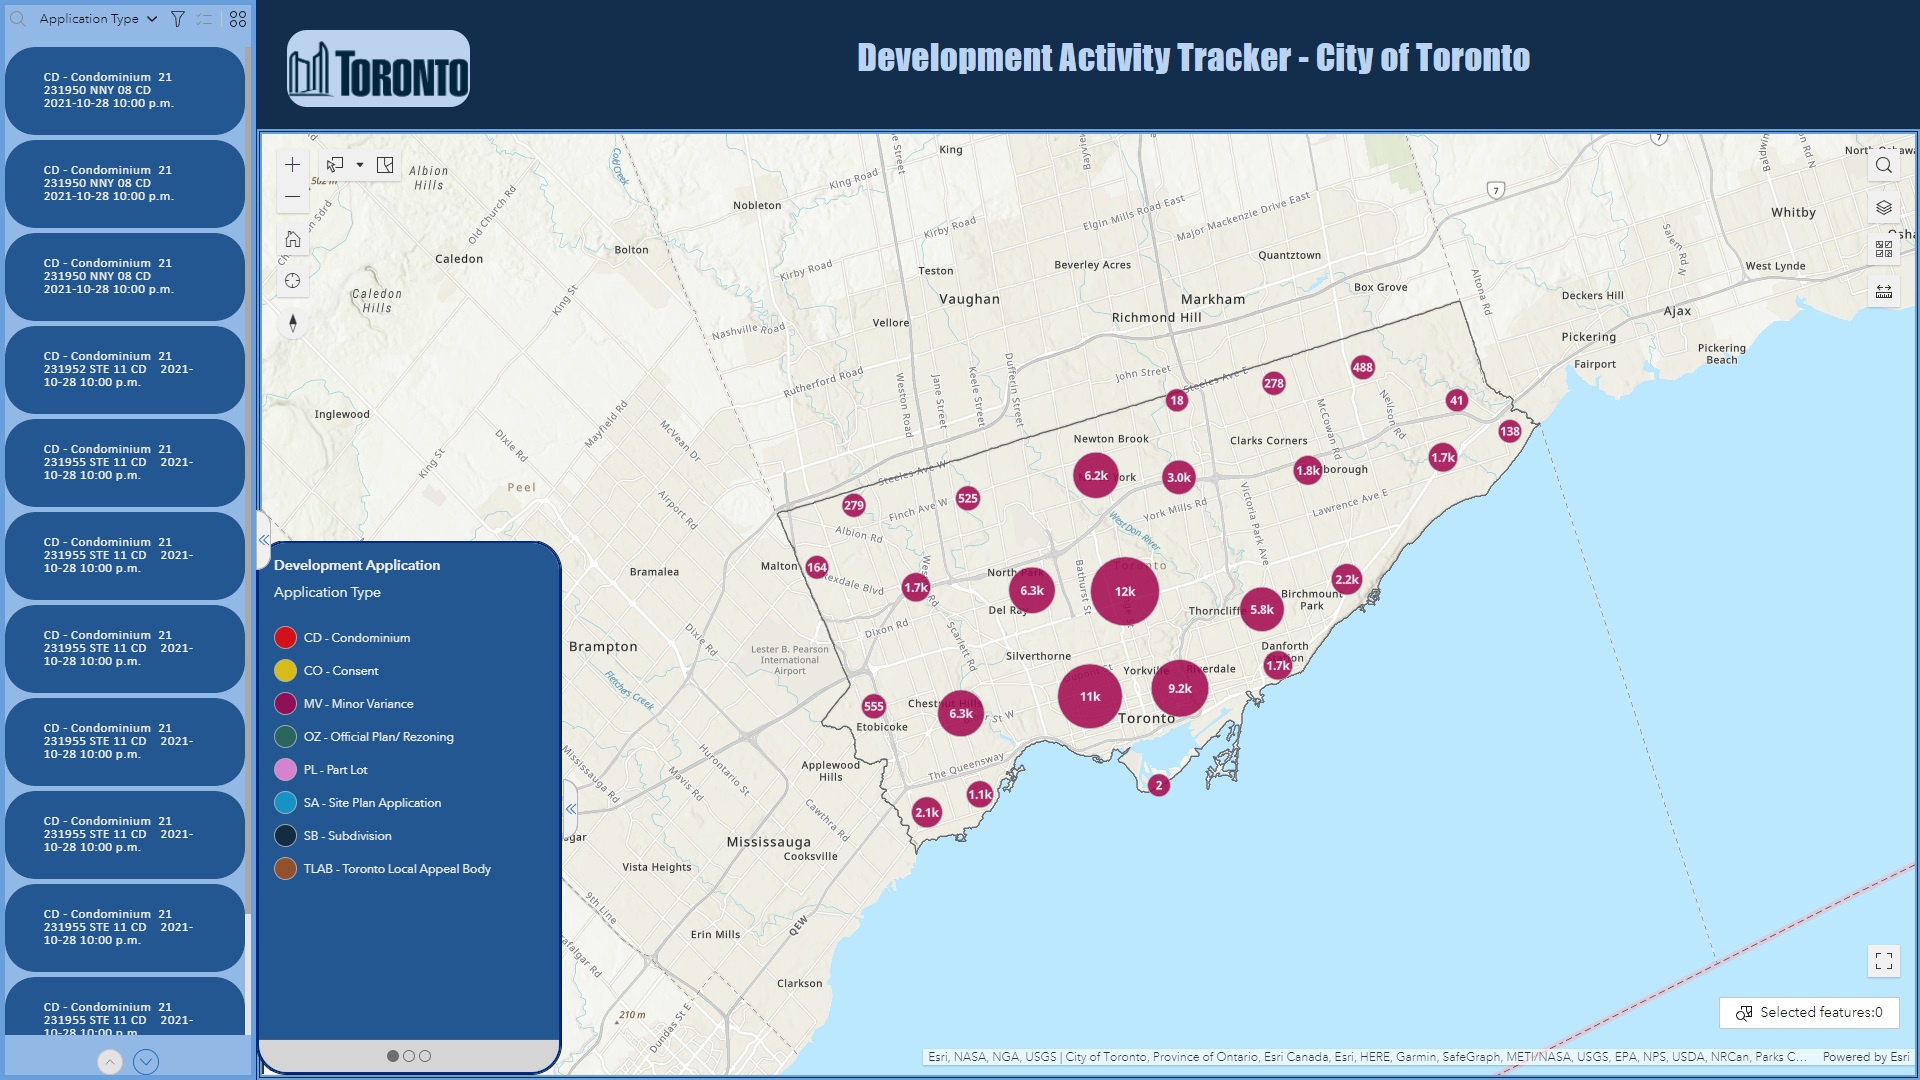
The experience builder enhances the cartographic visualisation of the web map and gives the users a more interactive experience through an application. It allows you to create unique web experienve using flexible layouts, content, and widgets that interact with 2D and 3D data. Users can drag the content, and use tools to interact with the data. It is also mobile adaptive, can be displayed on either large screens or smal screens.
ArcGIS StoryMaps
https://storymaps.arcgis.com/stories/110e1015cfc8455590998a8050d1998b
The story map educates the public by providing background information of the development activities in Toronto. The navigation bar is pinned at the top of the page, allowing the users to jump between sections quickly and obtain the information they want. The slideshow feature is ultilized to provide information about different development application types. The web map and the dashboard are included in the story map, allowing the users to explore the development activities interactively within the story map.
